

How to Present Event Success Metrics to Stakeholders
Attendance alone can’t show whether an event succeeded. Presenting event success metrics to stakeholders works best when you choose measures tied to the event’s objectives, use reliable data and make the next decision clear. Bring together registration and attendance, financial results, attendee engagement and feedback, then highlight what matters most to each stakeholder.
It’s easy to focus on the figures that are simplest to collect, but a useful report connects each result to the event’s purpose. A board may want to understand strategic alignment and return on investment, while a sponsor may focus on visibility and leads.
This guide explains how to select useful metrics, report registrations and finances clearly, and tailor findings to stakeholder priorities. You’ll also learn how to turn results into practical recommendations that support better decisions about future events.
Table of Contents
What are the key metrics to consider when measuring event success?
Choose measures that link directly to the event’s objectives and inform decisions. Compare results with targets, past events and stakeholder priorities.
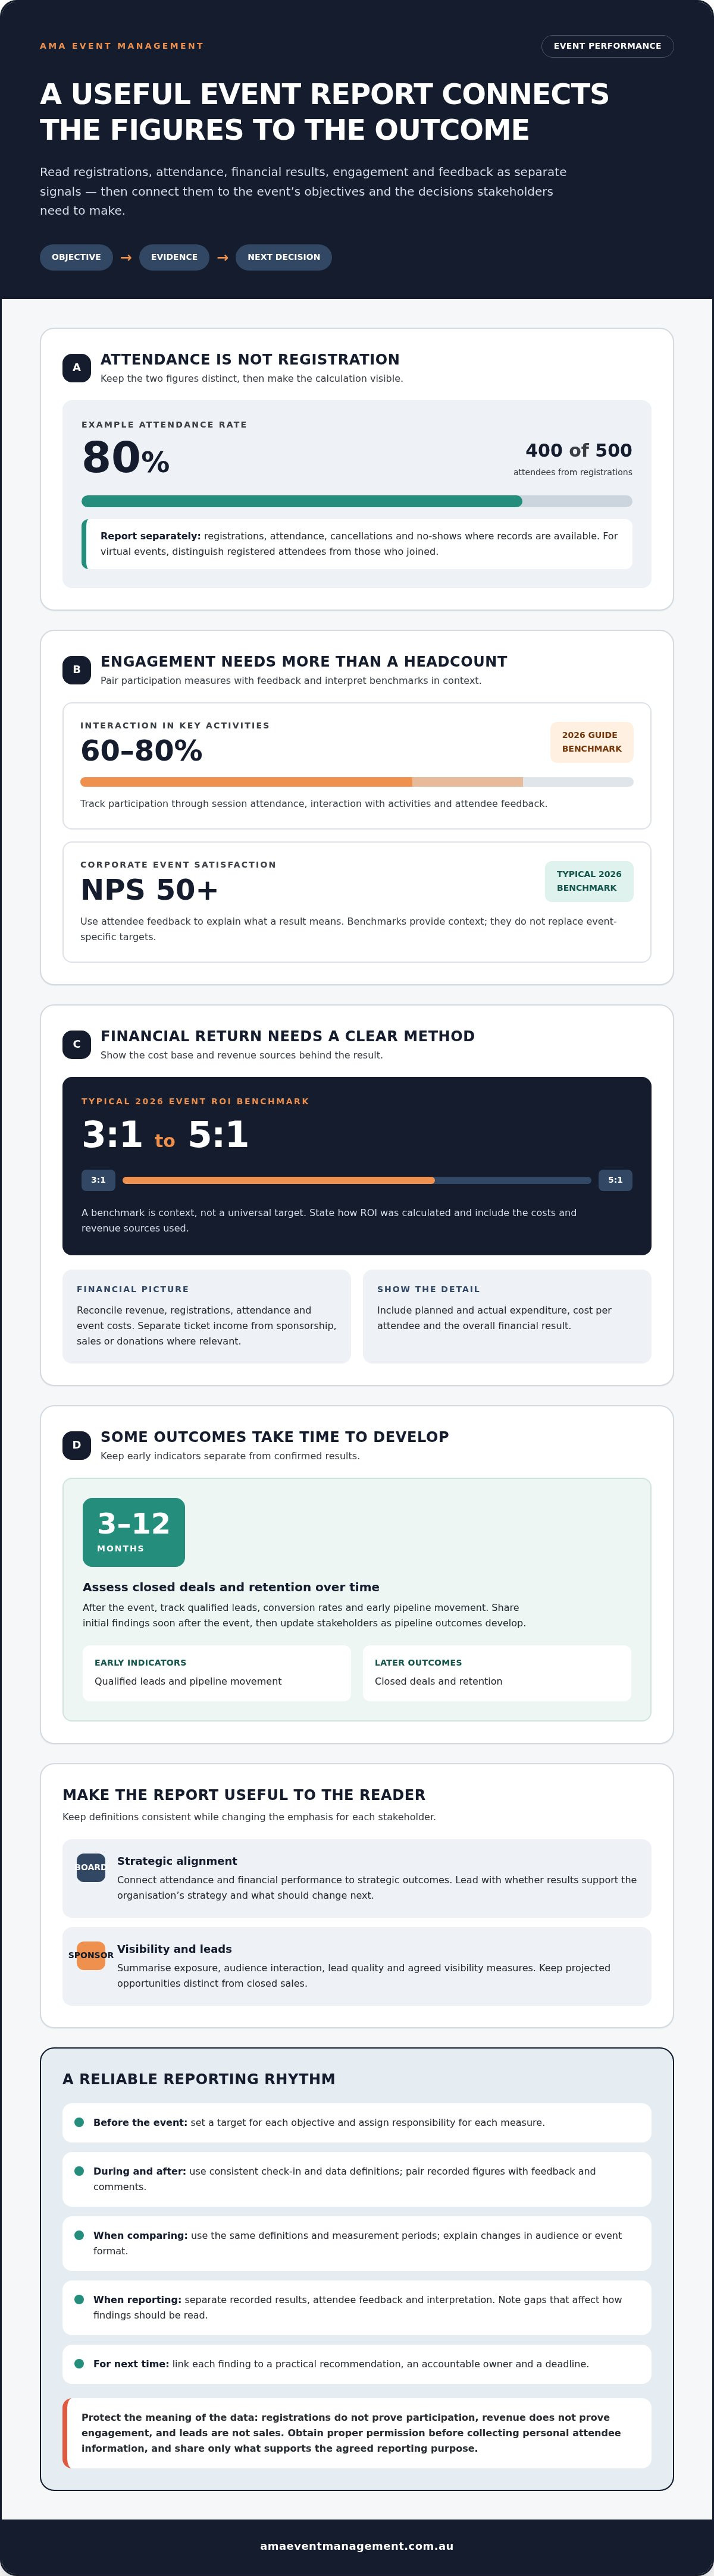
Collect quantitative and qualitative dataAssign responsibility for each measure before the event, then record attendance, revenue, participation and leads. Use a consistent check-in system and gather qualitative insights through feedback and comments. Obtain proper permission before collecting personal attendee information, and share only what supports the agreed reporting purpose. Pair figures with feedback to explain what the results mean.
Compare results with targets and past eventsSet a target for each objective, then compare the result with that target and a previous event using the same definitions. For example, report ticket sales against the prior year, noting changes in audience or event format that may affect the comparison. An increase matters most when it advances the event strategy, rather than standing alone. Avoid comparisons based on inconsistent data or different measurement periods.
Evaluate engagement and attendee satisfactionMeasure participation through attendance at sessions, interaction with activities and attendee feedback. A 2026 guide benchmark lists 60-80% interaction in key activities, while an NPS of 50+ is listed as a typical 2026 benchmark for corporate event satisfaction. Treat benchmarks as context, not a substitute for event-specific targets. Track qualified leads, conversion rates and early pipeline movement after the event; assess closed deals and retention over 3-12 months. Share initial findings soon after the event, then update stakeholders as pipeline outcomes develop. Avoid relying on attendance alone or presenting leads as sales.
Reporting on event finances and registrations
Separate registration activity from attendance, then connect financial results to the event’s objectives.
Review revenue and financial metricsStart by reconciling revenue, registrations, attendance and event costs in one report. Separate ticket income from sponsorship, sales or donations, where relevant, so stakeholders can see each revenue stream. Then show planned and actual expenditure, cost per attendee and the overall financial result. For example, an event with 500 registrations and 400 attendees has an 80% attendance rate. Make the calculation visible, and use consistent figures across registration platforms and finance records.Distinguish registered guests from those who attended. Report cancellations and no-shows where records are available, and explain how they affect the attendance rate. For virtual events, report registered attendees separately from those who joined. Registrations do not prove participation, just as revenue does not prove engagement. These indicators answer different questions and help stakeholders interpret performance.
Assess financial ROI and return on objectivesCalculate financial ROI by comparing the financial return with event costs, and state the method used. A guide lists a 3:1 to 5:1 ratio as a typical 2026 event ROI benchmark. Present it as context, not a target that suits every event. Include the cost base and revenue sources behind your calculation; otherwise, stakeholders can’t judge what the ratio represents.Assess return on objectives alongside financial ROI. An event may prioritise audience engagement, leads, sales or another defined outcome. Report progress against that objective, including qualified leads and pipeline movement where relevant. Keep projected opportunities distinct from closed sales. Pair financial results with a short survey finding or other feedback, so stakeholders can see both measurable returns and audience response. Use the combined evidence to decide what to adjust in the next event strategy.
Executive reporting and stakeholder priorities
Shape each report around its audience: a board needs strategic alignment, while sponsors need visibility and leads. Presenting event success metrics to stakeholders is clearer when each result supports a decision they need to make.
Lead with the decision. Open with the event’s objective, its outcome and the action stakeholders should consider. For a board, explain whether results support the organisation’s strategy and what should change next. For a sponsor, summarise exposure and lead outcomes. This gives each audience the key message before the supporting detail.
Match evidence to stakeholder priorities. Choose results that answer each group’s key questions. A board report might connect attendance and financial performance to strategic outcomes. A sponsor update could show audience interaction, lead quality and agreed visibility measures. Keep definitions consistent, even when the emphasis changes, so every version remains accurate and meaningful.
Separate findings from interpretation. Distinguish recorded results, attendee feedback and conclusions. For example, report what a post-event survey found, then explain how satisfaction relates to the event objective. Note gaps that affect interpretation, such as incomplete sponsor lead records. This helps readers assess the evidence without mistaking assumptions for results.
Turn insights into assigned actions. Pair each finding with a practical recommendation, an accountable owner and a deadline. If sponsor interaction was limited, propose a change to the activation or session format and assign responsibility for planning it. If board priorities were not met, identify which event component needs review. Track progress and report whether adjustments improve outcomes at the next event.
Choose a concise format for the audience. Use an executive summary to present the main decision, with tables or charts for readers who need detail. A board presentation can lead with strategic outcomes; a sponsor report can foreground visibility and leads. A clear structure for presenting event success metrics to stakeholders makes the evidence easier to understand and act on.
Choosing event success metrics
Select metrics by working backwards from the event’s purpose. A useful measure links an objective to reliable evidence and a decision.
Define the intended outcome first. Specify what the event should change, for whom and by when. An association event might aim to increase member attendance compared with the previous year. That objective points to a focused measure, rather than a broad collection of figures. Check that each proposed metric reflects an organisational priority and can inform a practical next step.
Choose a balanced set of indicators. Group measures into categories such as attendance, revenue, engagement, leads and satisfaction, then select those that match the objective. A brand activation may prioritise audience interaction and qualified leads; a fundraising event may focus on donations. Include qualitative feedback when figures alone cannot explain why participation rose or fell.
Define each metric before collecting data. Record the calculation, source, collection period and person responsible. For example, define attendance as checked-in guests, not registrations, and apply that definition consistently across comparable events. Specify how you’ll measure session participation or lead conversion. Consistent definitions make analysis more useful and prevent teams from comparing unlike figures.
Test whether each measure can guide action. Ask what decision a result could change. If low participation in a session would prompt a different format, session attendance may be useful. If a number has no reliable data source or won’t influence event strategy, leave it out. Choose measures that show progress, explain outcomes and support improvement, rather than tracking every available figure. For a market or festival, plan event measurement around clear objectives.
AMA Event Management: Market Management and Vendor Coordination
AMA Event Management helps organise events where coordinated delivery and clear objectives matter. Its Market Management and Vendor Coordination service supports market organisers managing vendor logistics and audience experience. Community Festivals and Fairs bring the moving parts of a community event together around a shared purpose. Themed Brand Activations and Corporate Conferences and Galas are also available for organisations planning events with defined audience and stakeholder outcomes.
Bring your objectives and intended measures into the planning conversation so event delivery aligns with what you need to assess afterwards. This is a practical next step when planning a market, festival, activation, conference or gala in Sydney or Melbourne and you want the event’s priorities to guide execution. Contact AMA Event Management to discuss your event.
Build measurement into your next event plan
Carry your measurement approach into the next planning cycle. Agree on the decisions the event should inform, the evidence you’ll need and how the team will use the findings. This makes presenting event success metrics to stakeholders part of event design, not just a report assembled afterwards. It also gives everyone a shared basis for refining the programme and setting priorities for future events.
For events with multiple moving parts, AMA Event Management offers Market Management and Vendor Coordination, Community Festivals and Fairs, and Themed Brand Activations. These services support organisers who want event objectives to inform planning and delivery from the outset.
Before your next event, consider which outcomes will shape your decisions and how the team can build those measures into its planning. Contact AMA Event Management to discuss your event and the priorities you want it to support. A considered plan creates a stronger starting point for learning and improvement.
Frequently Asked Questions
How can ROI be calculated for an event?
Calculate financial ROI by subtracting total event costs from attributable financial returns, then dividing by total costs. Multiply the result by 100 to express it as a percentage. Define which revenue sources count and how costs are allocated before calculating. If the event aimed to achieve a non-financial outcome, report progress against that objective separately rather than treating it as financial return.
How do I communicate event success to stakeholders?
Present the main outcome first, explain what it means for the stakeholder, then state the decision or next action. For example, a committee deciding whether to repeat an event needs to understand what worked and what should change. Use a short written summary for the main message, with supporting detail available for readers who want to examine the results.
Which KPIs measure event success for different event types?
Choose KPIs that reflect each event’s purpose. A community festival might track attendance, participation and attendee feedback; a corporate conference could monitor session attendance, satisfaction and qualified leads. A brand activation may focus on audience interaction and brand awareness. These examples are starting points, not a fixed scorecard: choose measures that show whether the event delivered its intended outcome.
How do you set event goals and success metrics before an event?
Start with the outcome the event must support, then define a measurable indicator and its data source. For example, if the goal is to increase attendance at a recurring event, compare check-in records with those from the previous event. Assign someone to collect each measure and decide how the result will inform planning. This makes evaluation part of event preparation, not an afterthought.
How do you calculate event ROI and cost per attendee?
For cost per attendee, divide total event costs by the number of people who attended, using checked-in guests rather than registrations. For ROI, compare attributable financial returns with total costs, using the same cost period and clear definitions. Keep the calculations separate: cost per attendee shows expenditure relative to attendance, while ROI indicates financial return against investment.
Which event metrics should be reported to stakeholders?
Report the measures that answer stakeholders’ questions and help them act. A concise update might include registrations, actual attendance, financial results, audience response and progress towards the event’s objective. Explain any major change from the plan, such as a session drawing fewer attendees than expected. Keep detailed calculations available as supporting evidence instead of crowding the main report.



Comments